In the realm of business and product development, the concept of Product Led Growth (PLG) has emerged as a transformative strategy that focuses on product usage as the primary driver of user acquisition, retention, and expansion. This approach is fundamentally about delivering a product that is so effective and user-friendly that it propels its own adoption and growth.
Understanding the metrics that quantify and measure this growth is crucial for businesses aiming to implement a PLG strategy. These metrics provide insights into the product's performance, user behavior, and the overall effectiveness of the PLG approach. In this glossary article, we delve into the intricacies of these growth metrics, providing a comprehensive understanding of their relevance and application in a PLG context.
Product Led Growth is a go-to-market strategy that relies on product features, functionality, and user experiences to drive customer acquisition, conversion, and expansion. Instead of traditional marketing or sales-driven approaches, PLG businesses focus on making their product the main vehicle for customer attraction and retention.
Companies like Slack, Dropbox, and Zoom are examples of businesses that have successfully implemented PLG strategies. They have developed user-centric products that provide significant value, thereby encouraging users to adopt and promote the product organically.
PLG businesses share a few common characteristics. First, they prioritize the user experience. The product is intuitive, easy to use, and delivers value from the first interaction. Second, they often have a self-service or freemium model, allowing users to try the product before committing to a purchase. This reduces the barriers to entry and allows users to see the value of the product firsthand.
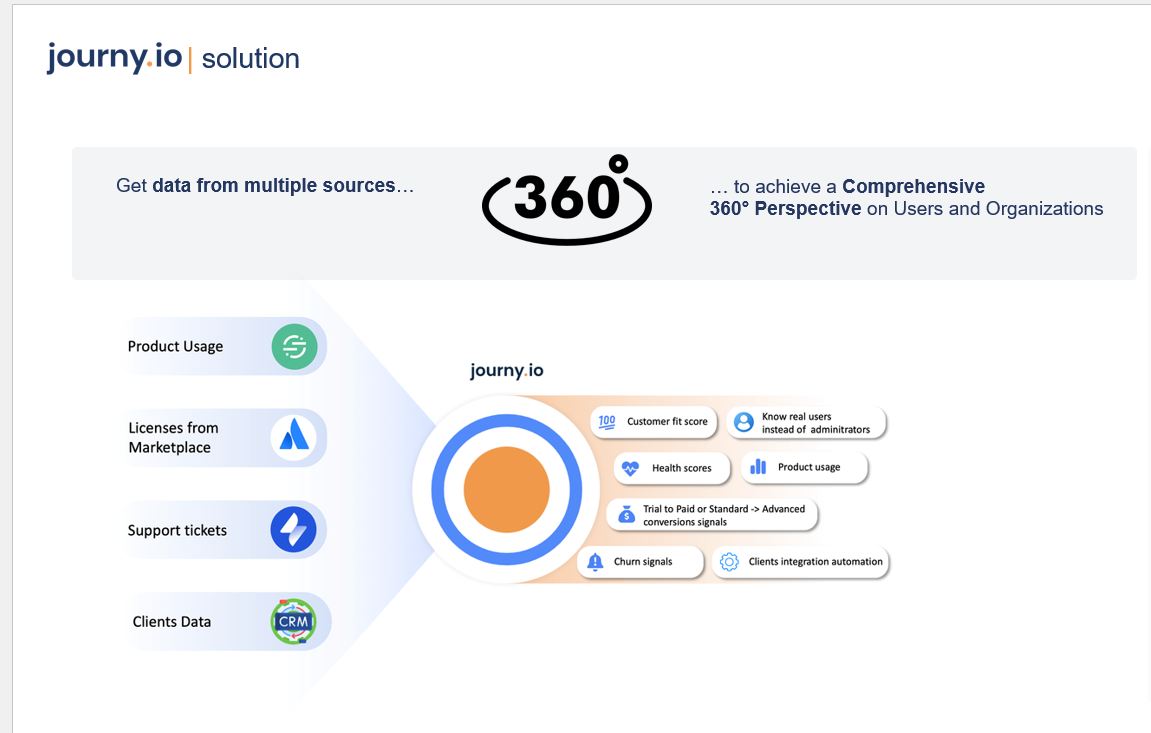
Third, PLG businesses leverage product usage data to inform their strategies. They track how users interact with their product, what features are most used, and where users encounter difficulties. This data-driven approach allows them to continuously improve the product based on user needs and behaviors.
Growth metrics are the key indicators that measure the success of a PLG strategy. They provide insights into user behavior, product performance, and business growth. Understanding these metrics allows businesses to make informed decisions, optimize their product, and drive growth.
While the specific metrics tracked can vary depending on the product and business model, there are a few key metrics that are generally relevant to all PLG businesses. These include acquisition metrics, activation metrics, retention metrics, and revenue metrics.
Acquisition metrics measure the effectiveness of a product in attracting new users. These metrics include the number of new users, the sources of these users, and the cost of acquiring these users. Tracking these metrics helps businesses understand where their users are coming from and how effectively they are attracting new users.
Key acquisition metrics include User Acquisition Cost (UAC), which measures the cost to acquire a new user, and Viral Coefficient, which measures the number of new users an existing user generates through referrals or sharing.
Activation metrics measure how effectively a product engages new users. These metrics include the number of users who complete key actions or reach key milestones within the product. Tracking these metrics helps businesses understand how well they are engaging and activating new users.
Key activation metrics include Activation Rate, which measures the percentage of users who complete a key action or reach a key milestone, and Time to Value (TTV), which measures the time it takes for a user to first realize value from the product.
Retention metrics measure how well a product retains users over time. These metrics include the number of users who continue to use the product over a given period. Tracking these metrics helps businesses understand how well they are retaining users and identify any issues that may be causing users to churn.
Key retention metrics include Churn Rate, which measures the percentage of users who stop using the product over a given period, and Daily Active Users (DAU) / Monthly Active Users (MAU), which measure the number of users who use the product on a daily or monthly basis.
Revenue metrics measure the financial performance of a product. These metrics include the revenue generated by the product, the average revenue per user, and the lifetime value of a user. Tracking these metrics helps businesses understand the financial impact of their PLG strategy.
Key revenue metrics include Monthly Recurring Revenue (MRR), which measures the recurring revenue generated by the product on a monthly basis, and Customer Lifetime Value (CLTV), which measures the total revenue a business can expect from a single customer over the duration of their relationship.
Growth metrics are essential in a PLG strategy as they provide insights into the product's performance, user behavior, and the overall effectiveness of the PLG approach. By tracking these metrics, businesses can identify areas of strength and weakness, make data-driven decisions, and continuously optimize their product and strategy.
Moreover, growth metrics provide a way to measure the return on investment of a PLG strategy. By comparing the cost of acquiring and retaining users with the revenue these users generate, businesses can assess the profitability of their PLG approach and make necessary adjustments.
Optimizing growth metrics involves continuously tracking these metrics, analyzing the data, and making improvements based on these insights. This could involve making changes to the product, adjusting the pricing model, or refining the user acquisition strategy.
For example, if the data shows that a significant number of users are churning after a certain point in the user journey, the business might investigate this issue and make changes to the product or user experience to address this problem. Similarly, if the data shows that a particular acquisition channel is particularly effective, the business might invest more resources into this channel to attract more users.
While tracking growth metrics is crucial, it can also be challenging. One of the main challenges is ensuring the accuracy and reliability of the data. This requires having robust data collection and analysis systems in place, and regularly auditing the data to ensure its quality.
Another challenge is interpreting the data and making informed decisions based on it. This requires a deep understanding of the product, the users, and the business model. It also requires the ability to analyze the data in context and make connections between different metrics and aspects of the business.
Product Led Growth represents a paradigm shift in the way businesses approach growth. By focusing on the product and the user experience, businesses can drive organic growth and create a self-sustaining growth engine. However, to effectively implement a PLG strategy, businesses need to understand and track the right growth metrics.
These metrics provide insights into the product's performance, user behavior, and the overall effectiveness of the PLG approach. By continuously tracking and optimizing these metrics, businesses can make data-driven decisions, continuously improve their product, and drive sustainable growth.
Create your account and watch your revenue metrics improve. No extra dashboards to manage, no extra tools or coding needed. All from data you already have and tools you're already using.
.png)